
With the EnMasse 0.28.0 release, using a Gitops workflow to manage your messaging application is even easier than before. Part 2 is a followup on Gitops and EnMasse with focus on the operations side of things. I recommend that you read that article first to get an overview of gitops and EnMasse in general.
As in the previous article, lets assume that you have a team in your organization managing the messaging infrastructure using EnMasse on Kubernetes or OpenShift, and that you have 2 independent developer teams that both want to use messaging in their applications. The following diagram describes the flow:
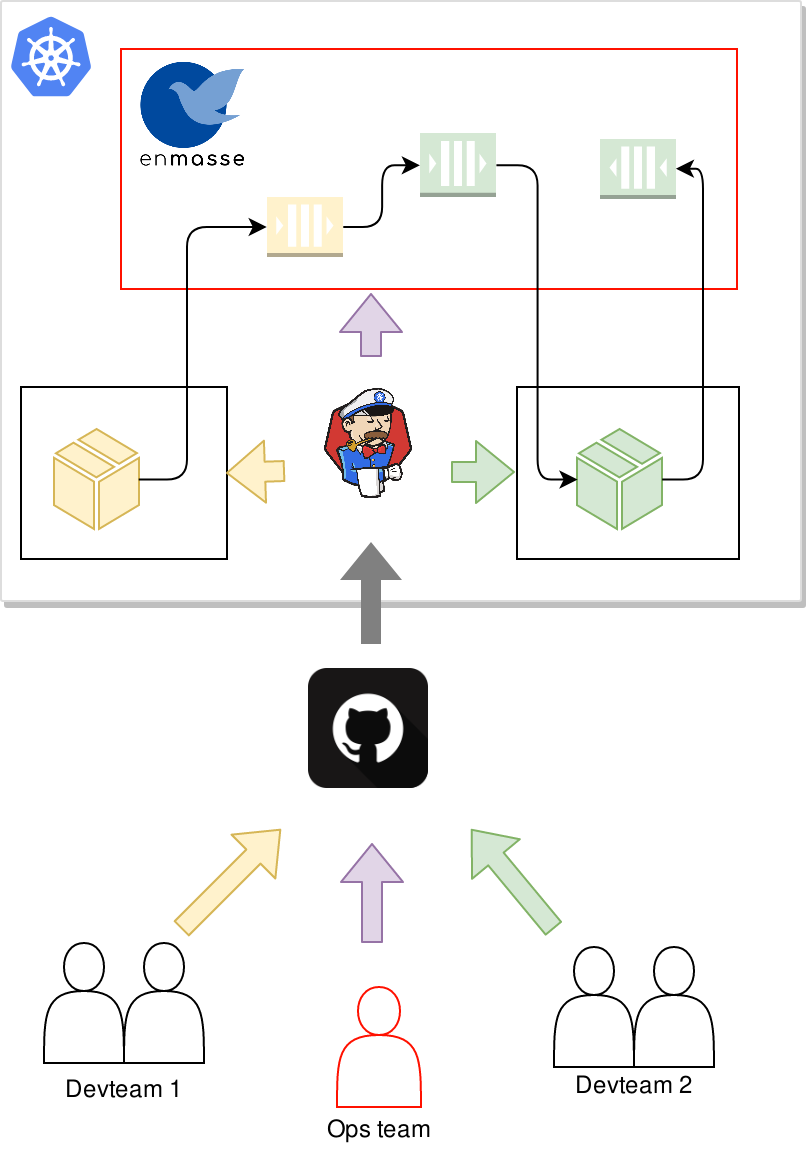
The operations team install EnMasse, and commit the desired configuration templates that they want to support to git. A CI process then applies the EnMasse configuration to the cluster.
In this article, we will start with an EnMasse release, remove the bits we don’t need, and apply configuration specific to the service we are going to offer. We want to provide the following:
- Allow development teams to provision brokers of different t-shirt sizes on-demand
- Allow development teams to manage authentication and authorization policies for their messaging applications
- Allow operations to monitor the messaging infrastructure and receive alerts if development teams are having issues applying their configuration
Installation
Managing an EnMasse deployment in git can be as simple as unpacking the release bundle and committing the parts that is used for a particular installation. The examples used in this article were tested by applying the resources in the install/bundles/enmasse and install/components/example-roles folders.
The installation guide covers the process of installing EnMasse in detail.
Configuration
Once EnMasse is installed, it needs to be configured. EnMasse is configured by creating one or more instances of the following resources:
AuthenticationService- Describes an authentication service instance used to authenticate messaging clients.AddressSpacePlan- Describes the messaging resources available for address spaces using this plan.AddressPlan- Describes the messaging resources consumed by a particular address using this plan.StandardInfraConfig- Describes the Qpid Dispatch Router and ActiveMQ Artemis configuration for the standard address space type.BrokeredInfraConfig- Describes the ActiveMQ Artemis configuration for the brokered address space type.
When created, these resources define the configuration that is available to the messaging tenants. The relationship between all these entities are described in this figure:
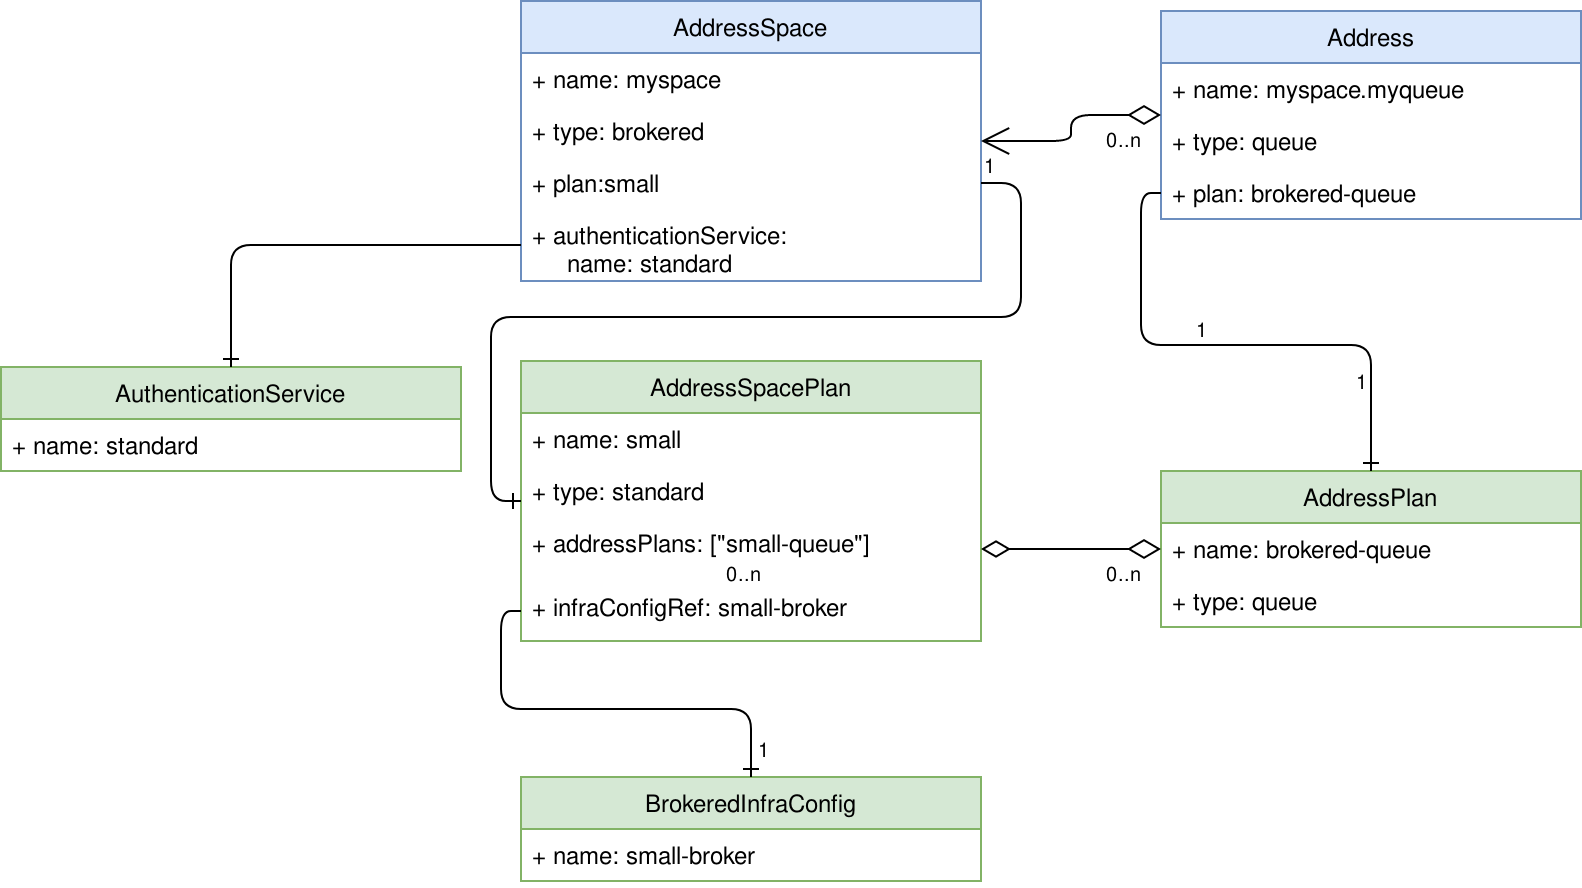
The green entities are those which are managed by the operations team, while the blue entities are created by the developer teams.
In this article, we will create a configuration to serve the needs of our developer teams. For evaluation purposes, applying the install/components/example-plans and install/components/example-authservices will give you a full EnMasse setup with various example configurations.
Authentication services
Authentication services are used to authenticate and authorize messaging clients using SASL. AMQ Online supports 3 types of authentication services supporting different SASL mechanisms:
none- Supports any mechanism, but will grant all clients full access.standard- Supports PLAIN, SCRAMSHA1, SCRAMSHA256 and SCRAMSHA512 mechanisms as well as using OpenShift service account tokens.external- Implement your own authentication service bridge to your own identity management system.
A standard authentication service will allow developer teams to apply authentication and authorization policies for their address spaces:
apiVersion: admin.enmasse.io/v1beta1
kind: AuthenticationService
metadata:
  name: standard-authservice
spec:
  type: standard
Infrastructure configuration
Configuration such as as memory, storage, access policies and other settings that relate to a broker can be specified in the infrastructure configuration.
The BrokeredInfraConfig resource type is used to define the configuration for the infrastructure serving the brokered address space types:
apiVersion: admin.enmasse.io/v1beta1
kind: BrokeredInfraConfig
metadata:
  name: small-broker
spec:
  broker:
    addressFullPolicy: FAIL
    resources:
      memory: 512Mi
Then, we also want to provide configuration for brokers that are larger:
apiVersion: admin.enmasse.io/v1beta1
kind: BrokeredInfraConfig
metadata:
  name: large-broker
spec:
  broker:
    addressFullPolicy: FAIL
    resources:
      memory: 2Gi
      storage: 10Gi
The above configuration will provide 2 different broker configurations that can be referenced by the address space plans.
Plans
Plans control how much resources that are consumed by developer teams. In the brokered address space type, the teams will anyway get a single broker for each address space, which makes the relationship between AddressSpacePlan and the BrokeredInfraConfig seem a bit over-complicated. However, for standard address space types, different plans may apply different resource limits using the same underlying infrastructure config, in which case there would not necessarily be a 1:1 mapping between the two.
Address space plans
The address space plan configures the max amount of resource that may be in use by an address space. In our case, we will have to define 2 plans, each referencing a BrokeredInfraConfig for the broker configuration:
---
apiVersion: admin.enmasse.io/v1beta2
kind: AddressSpacePlan
metadata:
  name: small
spec:
  addressSpaceType: brokered
  infraConfigRef: small-broker
  addressPlans:
  - broker-queue
  - broker-topic
  resourceLimits:
    broker: 1.0
---
apiVersion: admin.enmasse.io/v1beta2
kind: AddressSpacePlan
metadata:
  name: large
spec:
  addressSpaceType: brokered
  infraConfigRef: large-broker
  addressPlans:
  - broker-queue
  - broker-topic
  resourceLimits:
    broker: 1.0
Address plans
The address plan configures the amount of resource an address uses on the broker instances:
---
apiVersion: admin.enmasse.io/v1beta2
kind: AddressPlan
metadata:
  name: broker-queue
spec:
  addressType: queue
  resources:
    broker: 0.001
---
apiVersion: admin.enmasse.io/v1beta2
kind: AddressPlan
metadata:
  name: broker-topic
spec:
  addressType: topic
  resources:
    broker: 0.001
With this plan, developers may create up to 1000 addresses.
Monitoring
EnMasse provides examples for monitoring using Prometheus, Alertmanager and Grafana. The examples assume that you have deployed the Prometheus Operator for Prometheus and Altertmanager, and Grafana Operator for setting up Grafana dashboards. An easy way to get both is to install the Application Monitoring Operator, which is covered in the master branch documentation.
This section will focus on the resources operated by the above operators.
Service monitor and scraping
The ServiceMonitor resource allows us to define the endpoints that should be scraped by Prometheus. For EnMasse, the components use the health port of its components to provide Prometheus metrics:
apiVersion: monitoring.coreos.com/v1
kind: ServiceMonitor
metadata:
  name: enmasse
  labels:
    monitoring-key: middleware
    app: enmasse
spec:
  selector:
    matchLabels:
      app: enmasse
  endpoints:
  - port: health
  namespaceSelector:
    matchNames:
    - enmasse-infra
Once the prometheus operator applies this configuration to Prometheus, all components in EnMasse will be scraped for metrics.
Health checks and alerts
The prometheus operator allow you to define alerts for metrics by defining a PrometheusRule. In our case, we want alerts to trigger if:
- An EnMasse component is down (api-server or address-space-controller)
- An AddressSpace has been in the “not ready” state for more than 5 minutes.
- An Address has been in the “not ready” state for more than 5 minutes.
The first alert relates to the EnMasse infrastructure itself, whereas the last 2 relate to the resources created by the developer teams. By alerting on their state, we can receive alerts about infrastructure failures in advance of development teams raising an issue.
apiVersion: monitoring.coreos.com/v1
kind: PrometheusRule
metadata:
  labels:
    monitoring-key: middleware
    prometheus: k8s
    role: alert-rules
  name: enmasse
spec:
  groups:
  - name: ComponentHealth
    rules:
    - record: address_spaces_ready_total
      expr: sum(address_space_status_ready) by (service,namespace)
    - record: address_spaces_not_ready_total
      expr: sum(address_space_status_not_ready) by (service,namespace)
    - record: component_health
      expr: up{job="address-space-controller"} or on(namespace) (1- absent(up{job="address-space-controller"}) )
    - record: component_health
      expr: up{job="api-server"} or on(namespace) (1- absent(up{job="api-server"}) )

    - alert: ComponentHealth
      annotations:
        description: "{{ $labels.job }} has been down for over 5 minutes"
        severity: critical
      expr: component_health == 0
      for: 300s
    - alert: AddressSpaceHealth
      annotations:
        description: Address Space(s) have been in a not ready state for over 5 minutes
        value: "{{ $value }}"
        severity: warning
      expr: address_spaces_not_ready_total > 0
      for: 300s
    - alert: AddressHealth
      annotations:
        description: Address(s) have been in a not ready state for over 5 minutes
        value: "{{ $value }}"
        severity: warning
      expr: addresses_not_ready_total > 0
      for: 300s
Pretty things - Grafana dashboards
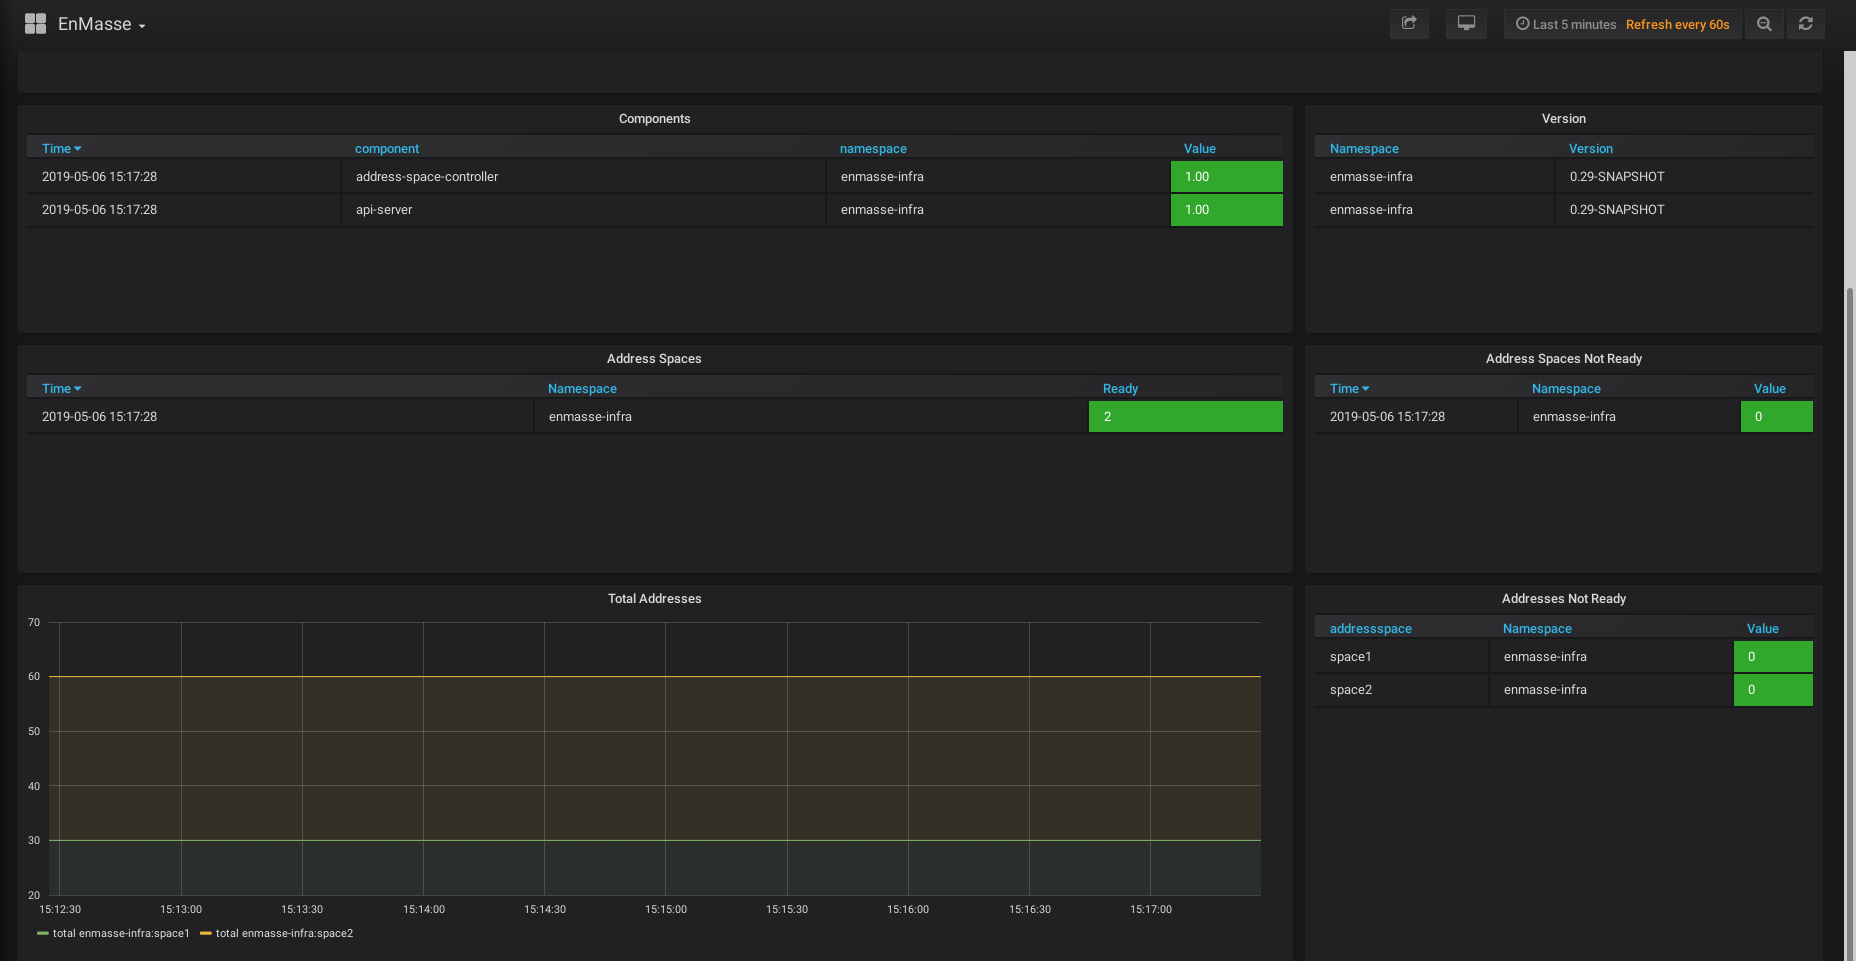
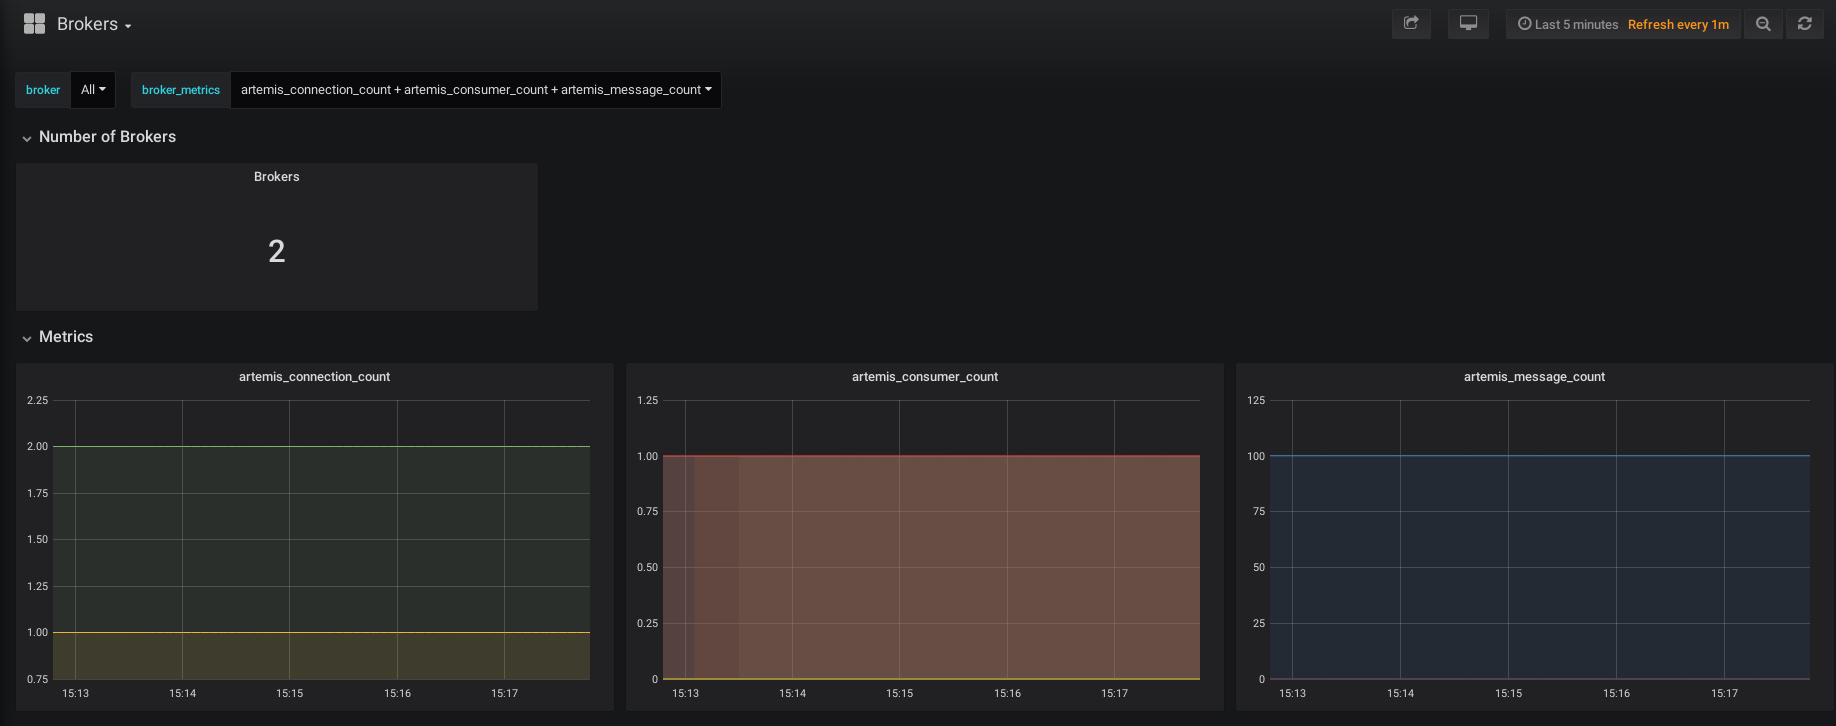
As a respectable operations team, you must have graphs to look at while drinking coffee, or to point to when your manager asks if everything is running. EnMasse offers a selection of Grafana dashboards that allow you to inspect the health of the system, as well as some graphs from the Qpid Dispatch Router (if used) and ActiveMQ Artemis brokers.
These resources are mainly configuration of the Grafana UI and can be found here.
The system dashboard:
The broker dashboard:
Summary
We have seen how an operations team can manage EnMasse. The configuration is described as Kubernetes Custom Resources, and is tailored specifically against the needs of the developer teams. Finally, we have seen how the operations team can configuring monitoring of the messaging infrastructure.